

Welcome to the arctic monitoring web-site
The Danish Arctic research institutions present updated knowledge on the condition of two major components of the Arctic: The Greenland Ice Sheet and the sea ice
Ice Sheet Melt Above Long Term Average for July
Ruth Mottram, Jason E. Box, Peter L. Langen, Polar Portal
A cooler, snowier early July suppressed melt rates over the ice sheet initially but the last 2 weeks of July had higher temperatures and clear skies and extensive melt returned. Overall the 2013 melt season is on track to be behind only 2010-2012 in terms of surface mass loss.
The comparative pause in melting at the end of June and beginning of July and some heavy snowfalls in the south and east in particular were soon followed by strong melt events around the middle and towards the end of July as shown in Figure 1. The most negative day of the melt season so far was on the 25th July when a cumulative total of around -12.48 Gt of water (by comparison the most negative single day in 2012 was around -20 Gt) was calculated to have been lost from the surface mass balance of the ice sheet. This large melting event was caused by warmer air moving over Greenland from the south east and clear skies which enhanced the melting.
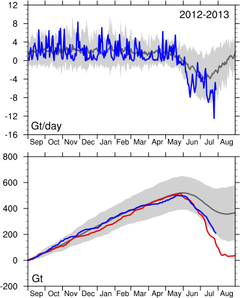
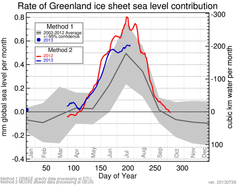
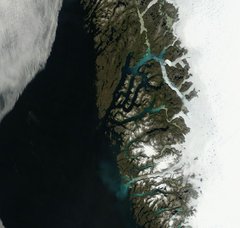
Figure 1. a) Surface mass balance calculated daily (upper panel) and cumulative over the season (lower panel) for the whole ice sheet; b) Cumulative total mass balance estimate for Greenland; see polarportal.org for full explanation of these figures. c) Clear skies with perfect conditions for melt over Greenland are seen in this spectacular NASA MODIS TERRA satellite image of the Nuuk region of Greenland taken on the 28th July. Note the lighter white fresh snow compared to the darker exposed glacier ice at lower levels. The small blue spots on the ice sheet surface are surface meltwater lakes.
Greenland's seasonal weather patterns are strongly influenced by the North Atlantic Oscillation (NAO). This is a regional scale pattern of high and low air pressure systems that can alternately cause cold air from the north to dominate the island (the positive mode) or allows warmer air from the south to move over the ice sheet (in the negative mode).The pattern of a cooler early July and warmer late July with more extensive melt correlates very clearly with a switch from a positive mode to a negative mode in the North Atlantic Oscillation index which occurred 15th – 18th July. The negative mode of the NAO persisted for much of the record setting 2012 season, promoting the delivery of warmer air and clear skies but has been less prominent this year.
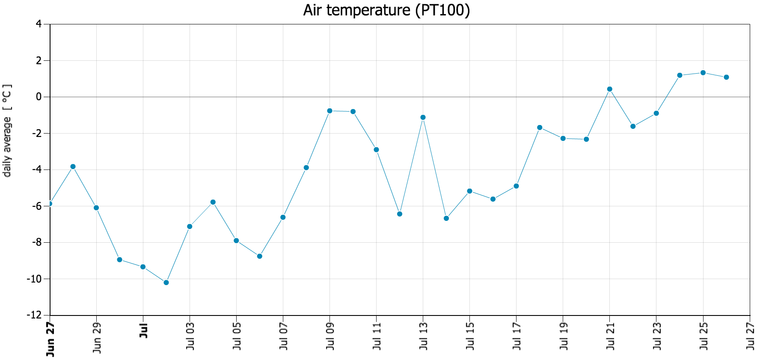
This summer the long stable period of hot sunny weather experienced in Denmark and northern Europe has in part been a consequence of the positive mode with a high pressure system centred over Scotland and to the south west of the British Isles. In contrast, this North Atlantic see-saw means that Greenland had rather cooler weather until the later part of the month when the change occurred. In late July (25th – 28th) the melt area expanded to such a large extent that the model results were confirmed by satellite observations from the MODIS sensor which showed melting in the Saddle region. This is unusual though not unprecedented and coincided with positive daily mean temperatures (up to 1.5 oC) recorded at at an elevation of 1850 m at the PROMICE KAN-U weather station for 3 days in a row (Figure 2). A further interesting feature of the melt area this year is the relatively high melt seen in Northern Greenland.
Warmer temperatures and clear skies were observed in the Arctic Ocean close to Greenland and this appears to have also influenced the surface mass balance of this part of the ice sheet. Relatively high temperatures recorded by the PROMICE KPC_Upper and KPC_lower stations in NE Greenland, where daily mean temperatures of up to 5.5 oC (at KPC-L) were recorded in mid-July, at the same time as the DMI weather station at the Danish military Station Nord recorded temperatures above 10oC. Northern Greenland has a dry climate and this year there was even less snow accumulation than usual. Once melting starts it tends to increase quite dramatically as the darker old ice is exposed by the melting of lighter new snow, this process is known as the albedo feedback.
 |
In spite of the strong melt in late July, the delayed start to the melting season means that the albedo feedback could not become as strong as previously. Now past the mid-point of the melt season (usually 15 July), it is too late for 2013 to produce melting anywhere nearly as large as we saw in 2012. The NASA MODIS albedo data indicate that the 2013 Greenland mid melt season (mid-July) albedo is higher overall (which means more reflective and thus reduced melt) than in 2009-2012. The mid July reflectivity of the ice sheet is 5% higher than it was in 2012 but somewhat lower (darker) than the average in the interior of the ice sheet. These features are likely to be related to both the precipitation in early July, which was particularly marked in the South and East of Greenland and possibly also to the widespread melt in 2012 which produced a darker snow layer and which may be still visible in the MODIS satellite imagery as the MODIS sensors can see through the top decimeters of snow. The DMI HIRLAM model indicates that much of the interior of the ice sheet has accumulated less than a meter of snow in depth since the start of the year.
The annual melt season in Greenland typically continues to late September, though melt may also occur much later in some areas depending on local weather. However, the melt extent is usually at its peak in July, so this analysis indicates that while we expect 2013 to be a low SMB year compared to the mean, it will not compare to 2012.
