
Welcome to the arctic monitoring web-site
The Danish Arctic research institutions present updated knowledge on the condition of two major components of the Arctic: The Greenland Ice Sheet and the sea ice
Greenland ice sheet climate before summer 2013: a climate of temperature and precipitation extremes
Written by: Jason E. Box, Peter Lang Langen, Signe Bech Andersen
Date: 18 June, 2013.
Key Statements
- Greenland air temperatures have climbed sharply since the mid 1990s. The recent decade is probably the warmest since during the Medieval Warm Period, which ended approximately 860 years ago.
- There has been a modest (12% to 20%) increase in snowfall rates over Greenland since the 1840s, associated with increasing atmospheric temperatures.
- A continuous net ice loss from Greenland has been observed since a period of stability and modest growth during the 1970s/1980s. Since the Little Ice Age ended in 1900, observation-based ice sheet reconstructions indicate accelerating ice loss. The largest ice loss rates since 1840 have occurred in the most recent decade.
- The contribution to global sea level rise from the Greenland ice sheet in the period 2002 to 2010 was more than 6.1 mm. After the thermal expansion of the oceans, this makes Greenland the largest single contributor to observed global sea level rise.
- In 2012 there was record ice loss from the Greenland Ice Sheet.
- Surface air temperatures in spring 2013 were above normal with very little snowfall in all areas except the south east. Simultaneously, it was a cold spring in Northwestern Europe. The well-known opposite temperature pattern between Western Greenland and Northwestern Europe has been strong in both summer and winter since 2007.
- In 2013, pre-melt season observations and atmospheric modelling indicate a more variable climate than has been usual for Greenland in recent decades, with extremes of snowfall and temperature, making the coming warm season climate difficult to predict.
- There is growing evidence that declining Arctic sea ice is influencing the Northern Hemisphere mid-latitude and North Atlantic climate, including the Greenland Ice Sheet, leading to persistent warm or cold, wet or dry weather.
 |
Surface melt
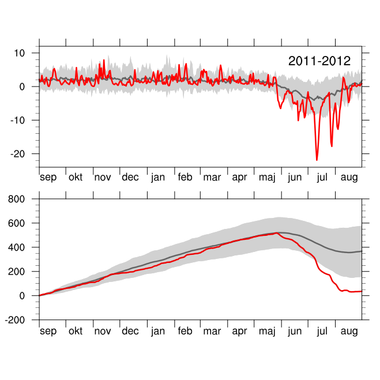
There are two ways the Greenland Ice Sheet loses mass: calving of icebergs from the marine-terminating glaciers and melt water from the surface of the ice sheet. The surface contributions are from snowfall, sublimation (evaporation from snow and ice) and melt. Averaged over the entire ice sheet, this so-called “surface mass balance” has been decreasing since the mid-1990’s and has reached record low levels in years 2010 and 2012 (1).
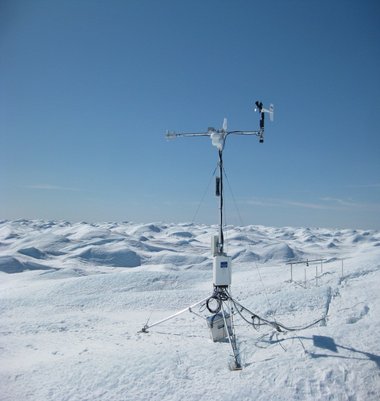
In the summer of 2012, a kind of heat wave rolled over Greenland, causing extreme melt rates and producing some melt over 98% of the ice sheet. The average maximum melt area is under 66%. Year 2012 also stands out together with 2010 as extreme melt years, as observed by the PROMICE automatic weather stations, with a record-setting end-of-year total vertical melt of over 8 m of ice for the Southern Greenland QAS_L station.
Surface mass balance modelling indicates that Greenland surface mass balance was 350 to 400 Gt below normal and consequently very close to zero for the period from September 2011 to August 2012 (1). For the ice sheet to be in mass balance, the surface mass balance should be a positive quantity that is balanced by mass loss from iceberg calving and bottom melting. The large negative surface mass balance anomaly resulted mainly from a series of large melt events over the summer season, of which the one in mid-July was the strongest.
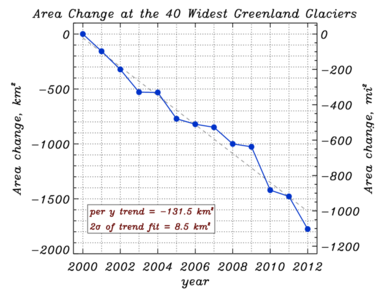 |
Glacier Changes
Marine-terminating glaciers are the outlets through which solid ice can move most rapidly and in large quantities to the ocean from the inland ice sheet reservoir. Icebergs breaking off (calving) and the retreat of the glaciers lead to ice flow acceleration and inland ice sheet mass loss, which adds to sea level. Sea level does not change if ice loss is balanced by snowfall gain. However, this balance has been strongly negative (ice loss to ocean) since a cold period in the 1980s and the end of the Little Ice Age in the late 1800s.
Surveys of visible satellite imagery indicate that in the year prior to the end of the 2012 melt season, marine-terminating glaciers collectively lost an area of 297 km2 (2). This rate was partly driven by the loss of a 150 km2 area of ice from the Petermann Glacier in far Northwestern Greenland. In 2010, the Petermann Glacier lost 240 km2 of surface area. These combined losses removed Petermann from its position as the Arctic’s largest ice shelf, which is now held by the thinning Northeast Greenland “79” glacier.
 |
 |
Total mass change and contribution to global sea level
Combining observation-based records from coastal and inland weather station temperature readings, ice cores, and regional climate modelling has enabled a reconstruction if ice sheet volume changes (4). These indicate that the contribution of the ice sheet to sea level has accelerated and amounts to a total of 28 mm since 1840, reaching a peak sea level contribution of +6.1 mm per decade during 2002 to 2010 (Fig. 5).
Since 1840, when Greenland was still in the Little Ice Age, the melt water runoff has increased by 60% (5), and the marine ice loss (calving plus underwater melting of marine-terminating ice) has increased by 44%. These losses are larger than the 12% to 20% snowfall increase over the Greenland Ice Sheet since 1840 (6).
In short: the Greenland Ice Sheet is losing mass and apparently at an increasing rate.
 |
Observations in 2013 before the melt season
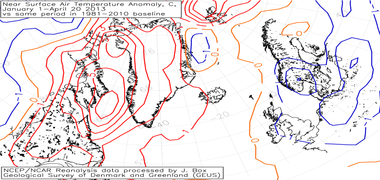
Climate data from January to March 2013 indicate abnormally high surface air temperatures and low precipitation along Western Greenland (Fig. 6), a combination that makes more melting likely during the warm season. Simultaneously, through the temperature “see saw” between Western Greenland and Northwestern Europe (7), Denmark had the coldest spring in decades. The opposite temperature variation between Western Greenland and Northwestern Europe is well known. In each summer since 2007, an extreme of this pattern has promoted additional melting over the ice sheet (8). There is growing evidence that declining Arctic sea ice is influencing the North Atlantic climate and upsetting weather even further to the south leading to stickier weather patterns whether they be warm or cold, wet or dry (9,10).
The pattern flipped beginning in late April 2013 as temperatures dropped well below normal and precipitation rates jumped.
In 2013, pre-melt season observations and modelling indicate a more variable climate than is usual for Greenland, with extremes of snowfall and temperatures, making the coming warm season climate difficult to predict. However, the past six summers in a row have been characterized by abnormally warm temperatures and clear skies over Greenland, linked with persistent extremes in atmospheric circulation that seem, in turn, associated with declining snow cover on land over North America and Siberia.
For data on precipitation, air temperatures, etc., please see section “Understanding the Greenland Ice Sheet”.
References
(1) Evidence and analysis of 2012 Greenlandrecords from spaceborne observations,a regional climate model and reanalysisdata. M. Tedesco1, X. Fettweis, T. Mote, J. Wahr, P. Alexander, J. Box, andB. Wouters. The Cryosphere, 7, 615-630, 2013.
(2) update to: Greenland marine-terminating glacier area changes: 2000–2010, Box, J.E. and D.T. Decker, Annals of Glaciology, 52(59) 91-98, 2011.
(3) A new programme for monitoring the mass loss of the Greenland ice sheet. A.P. Ahlstrøm, P. Gravesen, S.B. Andersen, D. van As, M. Citterio, R.S. Fausto, S. Nielsen, H.F. Jepsen, S.S. Kristensen, E.L. Christensen, L. Stenseng, R. Forsberg, S. Hanson, D. Petersen and PROMICE Project Team. Geological Survey of Denmark and Greenland Bulletin 15, 61-64, 2008.
(4) Greenland ice sheet mass balance reconstruction. Part III: Marine ice loss and total mass balance (1840-2010), Box, J.E. and W. Colgan, J. Climate, accepted 13 March, 2013.
(5) Greenland ice sheet mass balance reconstruction. Part II: Surface mass balance (1840-2010), Box, J. E., J. Climate, accepted 13 March, 2013.
(6) Greenland ice sheet mass balance reconstruction. Part I: net snow accumulation (1600-2009), Box, J.E., N. Cressie, D.H. Bromwich, J. Jung, Michiel van den Broeke, J.H. van Angelen, R.R. Forster, C. Miège, E. Mosley-Thompson, B. Vinther, J.R. McConnell, J. Climate, doi: dx.doi.org/10.1175/JCLI-D-12-00373.1 2013.
(7) van Loon, H. and J.C. Rogers, 1978: The Seesaw in Winter Temperatures Between Greenland and Northern Europe. Part I: General Description. Mon. Wea. Rev., 106, 296 310.
(8) Greenland ice sheet albedo feedback: thermodynamics and atmospheric drivers, Box, J. E., X. Fettweis, J.C. Stroeve, M. Tedesco, D.K. Hall, and K. Steffen, The Cryosphere, 6, 821-839, doi:10.5194/tc-6-821-2012, 2012.
(9) Evidence linking Arctic amplification to extreme weather in mid-latitudes, Francis, J. A., and S. J. Vavrus, Geophys. Res. Lett., 39, L06801, doi:10.1029/2012GL051000, 2012
(10) The recent shift in early summer Arctic atmospheric circulation, Overland, J. E., J. A. Francis, E. Hanna, and M. Wang, Geophys. Res. Lett., 39, L19804, doi:10.1029/2012GL053268, 2012.
(11) Kalnay et al.,The NCEP/NCAR 40-year reanalysis project, Bull. Amer. Meteor. Soc., 77, 437-470, 1996.
