

|

|

|
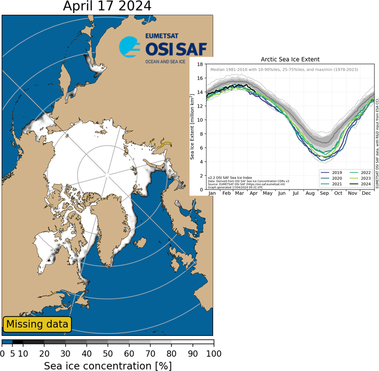
Date:

The map shows the sea ice extent in the Northern Hemisphere. It is updated on a daily basis.
In order to get a true picture of the state of the sea ice, it is necessary to determine its extent, thickness and volume.
The graph shows the annual variation in the extent of the sea ice in the Northern Hemisphere. The extent of the sea ice is defined by areas that have an ice concentration of at least 15%, i.e. 15% of the surface is covered by ice.
The grey band around the climatological mean value corresponds to plus/minus one standard deviation.
The extent of the ice is based on satellite data and are from the Ocean and Sea Ice, Satellite Application Facility project (OSISAF).
See also the map of the thickness and volume of the sea ice.
The ice cover in the Arctic grows throughout the winter, before peaking in March. Melting picks up pace during the spring as the sun gets stronger, and in September the extent of the ice cover is typically only around one third of its winter maximum.
Differences may occur in terms of the position of the edge of the ice in the two maps, “Extent of the sea ice” and “Thickness and volume of the sea ice”, as the model calculations do not always correspond exactly to the satellite sensors’ registration of the extent of the ice.
Ice concentrations are based on satellite data and are from the Ocean and Sea Ice Satellite Application Facility project (OSISAF).
