Welcome to the arctic monitoring web-site
The Danish Arctic research institutions present updated knowledge on the condition of two major components of the Arctic: The Greenland Ice Sheet and the sea ice
2013 ice mass loss from PROMICE weather stations
September 20, 2013
Robert S. Fausto, Signe B. Andersen og Jason E. Box
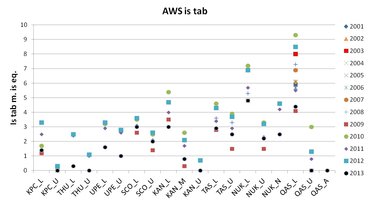
Melt season 2013 ice melt recorded by PROMICE automatic weather stations was below year 2010-2012 values placing 2013 near average like year 2009.
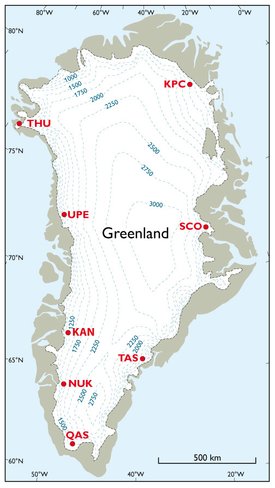
The Greenland ice sheet spans 2100 km north-south, and lies as much as 700 km below the Arctic circle where more than 9 m of ice melt has been observed (figure 2). Year 2013 ice melt for South and South-west Greenland ranged from 2.9 to 4.8 m (at TAS_L, QAS_L, NUK_L and KAN_L stations), while ice melt values at the more northerly KPC_L, SCO_L, UPE_L and THU_L stations range between 0.3 and 3 m at the lowest elevations (below 500 m above sea level). The melt values from higher elevation stations (above 500 m) range from 0.0 to 2.5 m in the south and from −0.4 to 2 m in the north.
This is in line with the calculated surface contribution to total the mass balance and although this is not alarming like the record melt of 2012, it is nevertheless an ice loss corresponding to a net total ice sheet sea level rise contribution.
The 2012 extremes in melt, air temperature, melt season duration, runoff, and albedo are shown to be unparalleled in the period with satellite and in situ observations on an ice-sheet-wide scale. The extreme 2012 values are mainly driven by a persistent high air pressure over Greenland accompanied by warm air import from the southwest while also associated with low cloud amounts and thus high amounts of solar radiation. The increased melt observed in Greenland in the past 6 summers suggests a change in the general circulation patterns of the Arctic.
A systematic, persistent change in the early-summer atmospheric circulation in the Arctic region are thought to be related to atmospheric circulation events called “blocking” providing conditions favorable for enhanced ice melt in Greenland. Conditions favoring increased melt have been most pronounced in the southern and western parts of Greenland.
Year 2013 however was characterized by colder north air inflow along west Greenland. Summer 2013 displayed overall low pressure, more clouds and precipitation over west Greenland despite some intense melt episodes in early June and late July. While melt onset in 2013 began late May as in 2012, the melt season was punctuated by snowfall a month earlier than in 2012 on 17 August.