
Welcome to the arctic monitoring web-site
The Danish Arctic research institutions present updated knowledge on the condition of two major components of the Arctic: The Greenland Ice Sheet and the sea ice
Sea level rise from the ice sheets: The worst case scenario?
31.aug.2020
By Dr. Ruth Mottram, Danish Meteorological Institute
Sea level is currently rising at a rate of about 4mm per year. More than half of this comes from melting glaciers and ice sheets. A new scientific study shows that the rate at which ice sheets are losing ice is at the high end of what climate models projected in the last large IPCC report (AR5 the 5th assessment report) outpacing what is expected from climate models given current greenhouse gas emissions. The reasons for this are different in Greenland and Antarctica suggesting more work is needed to understand how ice sheets lose their ice.
In the new paper, we compare the latest results from satellite observations and regional climate models for the Greenland and Antarctic ice sheets. These two vast glaciers, Greenland containing around 7m of sea level rise equivalent and Antarctica around 58m of sea level rise if it were all to melt completely, have in the last two decades shown some startling changes with both progressively losing ever more ice according to a range of studies put together by the IMBIE project.
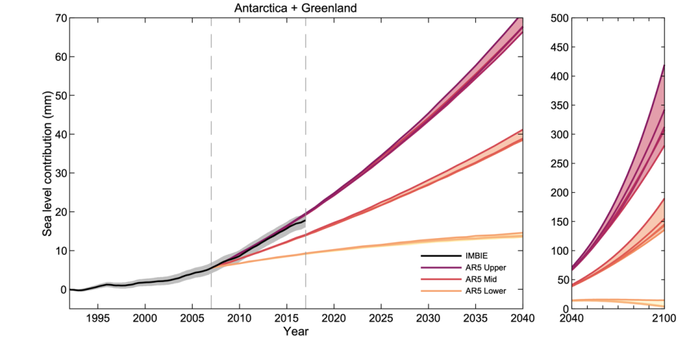
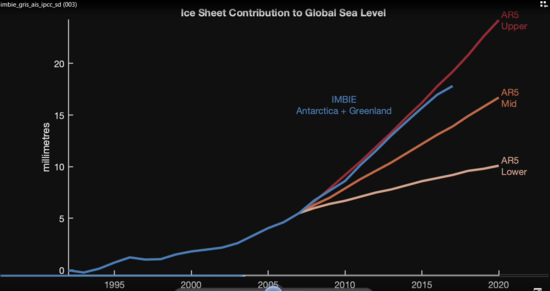
Since the satellite record began in the 1990s, Antarctica and Greenland together have raised global sea-levels by 17.8 mm, but the amount of ice lost every year is also increasing over time. Of the measured sea level rise, 7.2 mm is from Antarctica but the remaining 10.6 mm come from Greenland even though it’s a much smaller ice sheet.
Although it is not unexpected that the two ice sheets are losing increasing amounts of ice, the rate at which they are losing ice is unexpected. According to the last large IPCC report, the 5th Assessment report, the speed with which the two ice sheets are losing ice would only be expected under the very highest emissions scenarios, a scenario that we are not actually following.
 |
The ice lost from the ice sheets is adding to sea level rise but it is not the only cause. Until a few years ago the main cause of sea level rise was thermal expansion – as the oceans get warmer, because the air above is getting warmer, they expand. However, in the last five years extra water from the ice sheets melting as well as that added from the thousands of small glaciers and ice caps around the world outside the polar regions, many of which have shrunk even faster than the ice sheets, has now overtaken thermal expansion as the main cause of sea level rise.
Usually glaciers build up in the wintertime when there is snow accumulating at the top of the glacier and in the summer they melt and lose ice, this process is called the surface mass budget (SMB) and we show this for Greenland every day on the Polar Portal calculated from DMI’s weather forecasting model for Greenland. Glaciers can also lose ice dynamically – this means by the breaking off of icebergs or floating ice shelves where there can also be melting underwater. When the amount of snowfall is roughly the same as the amount of snow and ice melt and iceberg calving, the glacier stays the same size and there is no addition to sea level. However, if there is more snow than there is ice lost the glaciers will grow and conversely, more melt and icebergs than snowfall and the glaciers will shrink. Because of the fantastic quality of European Earth observation satellites we have been able to measure ice loss from the ice sheets over the last 30 years accurately and now have observations that can measure the change in height down to centimetre scale.
In our new paper we try to work out which process is most important for the two big ice sheets contributing to sea level rise. It turns out that they respond quite differently to the changing climate. In the Antarctic most of the ice is lost by dynamic processes – calving of large icebergs and melting under ice shelves. In Greenland however, melting, driven by a warmer atmosphere is responsible for the high increase in ice lost to the oceans. It is particularly the processes of melting in Greenland and dynamics in Antarctica that are underestimated compared to what has been observed in the last 10 years.
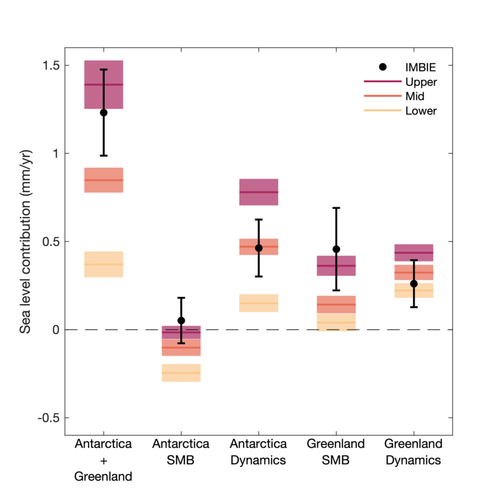 |
This means that scientists need to focus on processes in the atmosphere to understand why the ice lost from Greenland is higher than expected. In Antarctica, understanding the processes by which the ice sheet flows and breaks up (dynamics) and how the ocean affects the ice is more important if we want to accurately predict sea-level rise.
It is important to understand where sea level rise comes from if the loss of ice from the polar ice sheets continues along the upper end of projections, there will likely be an extra 14.5 to 23 cm of sea level rise from the ice-sheets alone above the average projections by the end of the century. This would greatly increase the cost of damages due to coastal flooding and make adapting to rising seas harder. Our calculations also suggest that ice sheet losses at the upper end of AR5 predictions would expose 44–66 million people to annual coastal flooding worldwide by the end of the century.
Moreover, as sea level rise is not spread equally around the world (see for example: https://sciencenordic.com/climate-change-denmark-forskerzonen/the-mind-bending-physics-of-scandinavian-sea-level-change/1452094), it is extremely important for local planners and politicians to find out where the water is coming from in order to have accurate local sea level rise projections. In Denmark, West Antarctica turns out to be extremely important for our local sea level rise.
A new EU funded project, PROTECT will start on the 1st September 2020 and including both polar portal partners and the University of Leeds along with other international partners to look into better quantifying sea level rise and preparing to adapt to it in the coming decades.
 |
Polar Portal is a collaboration between DMI, GEUS and DTU with funding from Dancea (Danish Cooperation for Environment in the Arctic) under the Danish Ministry for Climate, Energy and Utilities.
Polar Portal is also on Twitter: @PolarPortal and Facebook: https://www.facebook.com/PolarPortal/.
