
Welcome to the arctic monitoring web-site
The Danish Arctic research institutions present updated knowledge on the condition of two major components of the Arctic: The Greenland Ice Sheet and the sea ice
Still waiting for the melt season
Peter Langen and Ruth Mottram, DMI June 8th 2015
We have now passed the previous record for latest onset of the melting season on the Greenland Ice Sheet. Although interesting in itself, this does not statistically give us any pointers as to whether we are in for a large or small season-total melt.
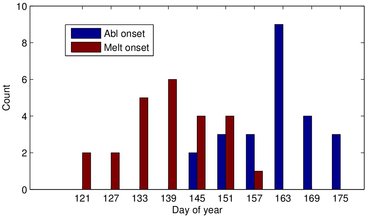
There is no official definition of the beginning of the melt season on the Greenland Ice Sheet, so last year we came up with not just one but two:
· Melting season onset: The first day of a period of at least three consecutive days where more than 5% of the ice sheet experiences melting. In our model, we define melting to occur in a place when the melt rate is greater than 1 mm/day.
· Ablation season onset: The first day of a period of at least three consecutive days where surface mass balance (SMB) is negative and below –1 Gt/day (1 Gt is one billion tons and corresponds to 1 cubic kilometer of water). See this article for a discussion of the difference between SMB and melt.
Using these definitions, we concluded last year that the melting onset (May 19) was near the middle of the list of all melt onsets since 1991. The ablation onset occurred June 11 and was also near the middle of its list. The total SMB for the entire Sep 2013 to Aug 2014 season ended up around 230 Gt placing it below average – on seventh lowest place, with the record-low held by the 2011-12 season.
We do not yet know the melt or ablation season onset dates for this year, simply because they have not occurred yet. For the ablation season onset, this is unremarkable as there is still plenty of time until the record-latest onset on June 28 (in 1999).
Melting season onset
According to our calculations, the last few days (June 6-7) have had 4% of the ice sheet area melting, so we have not yet reached the threshold in our definition. The previous record-latest melt onset was June 5 (in 2013) and we are now beyond this date and will be setting a new record.
So what does this mean for the season-total SMB? Statistically, nothing! Over the 24 seasons from 1991-2014 we have seen no correlation between melt season onset and season-total SMB. One would intuitively expect that a later melt-onset would give shorter time for melt and lower season-total melting. But there is no correlation and prominent counter-examples such as 1996 (record-earliest melt onset on Apr 29 and record-highest total SMB) and 2007 (fifth-latest onset on June 1 and second-lowest SMB).
Ablation season onset
Ablation season onset, on the other hand, does show some correlation with season-total SMB. It is nowhere near a definitive match, but there is a tendency for an earlier onset to give larger summer mass loss and lower season-total SMB. Ablation season onset has in the previous 24 years occurred anything from 4 to 50 days after melt season onset, never before melt season onset. However, this year we have actually been close with two days (June 3 and 4) below -1 Gt. This is quite surprising given the lack of melt and cold conditions in Greenland we have seen in the first part of summer. The explanation is that on cold clear days without precipitation, the sublimation (i.e., evaporation from the snow and ice surface) can contribute with substantial mass loss.
So this year we have been very close to seeing the first ablation season onset before melt season onset. It may still happen since neither of the two have yet occurred.
Cold and warm Arctic conditions in spring 2015 The anomalously cold conditions over much of Greenland, including some record low temperatures for May in north-east Greenland explain the late start to the melt season this year. Conversely Siberia and Alaska have seen some record breaking high temperatures this spring, and even the North Pole saw a “heatwave” in April. The cold conditions in Greenland therefore appear to be the result of a see-saw oscillation across the Arctic also related to the extreme cold conditions experienced in Canada and the US. |
|---|
