

Welcome to the arctic monitoring web-site
The Danish Arctic research institutions present updated knowledge on the condition of two major components of the Arctic: The Greenland Ice Sheet and the sea ice
And now it is melting – for real
Peter L. Langen, DMI/Polar Portal July 9th 2015
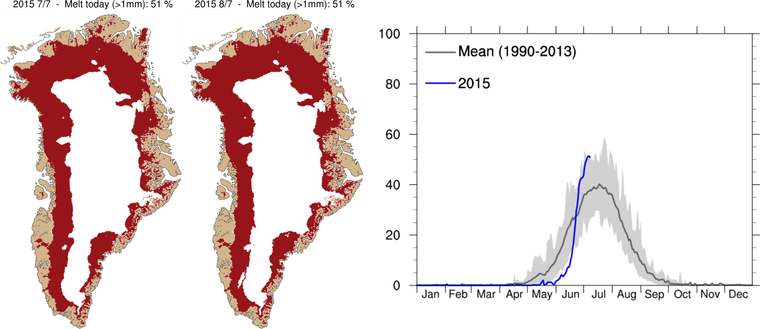
After a slow start to the melt season, Greenland Ice Sheet melt has really picked up pace. During the last week, half of the ice sheet has experienced melting at the surface. This means we have now come below the normal curve for the accumulated mass budget and it is continuing downwards rapidly.
A month ago we described how the melt season was slow to start due to a cold spring and early summer. In fact, with 12 June we saw the latest start of the melt season over the period of our calculations since 1991.
 |
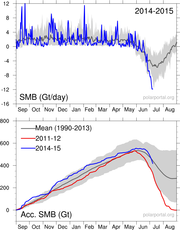
Since then, things have gone fast: already one week later, the ablation season, ie. the period where the ice sheet has a net surface mass loss started, and we are now losing more than 10 Gt per day at the surface (1 Gt is one billion tons and corresponds to 1 cubic kilometer of water). On July 6-8 the ice sheet surface lost 12 Gt per day and at this rate it is going rapidly downwards for the total mass budget. In fact, over the last week, we have lost about 30% of what is normally melted off in an entire melt season.
The total surface budget below normal
When the melt season started, we were slightly above normal for the accumulated surface mass budget. This means that since 1 September 2014, the ice sheet had received more mass from snowfall than usual for that time of year. In fact, it had been above normal ever since November. But the last few days’ heavy melting has reversed this and we are now just below normal.
Warmth in the Northeast
It has been warm particularly in the Northeast the last couple of days and surface melting reaches far up on the ice sheet. But the mass loss is not only coming from there. Also Northwest-, West and Southwest Greenland are contributing.
In 2012 we saw two distinct periods of heavy melting. Both on 11 and 27 July, the mass loss exceeded 15 Gt per day. It has not been quite so large this year but if the warm conditions persist, the total surface mass budget can really be drawn downwards.
 |
 |
