
Welcome to the arctic monitoring web-site
The Danish Arctic research institutions present updated knowledge on the condition of two major components of the Arctic: The Greenland Ice Sheet and the sea ice
Greenland ice sheet mass loss doubles
by Ruth Mottram and Christian Rodehacke, DMI
A new study shows that the Greenland ice sheet is now losing around 375 km3 of ice every year, more than double the amount of previous estimates. Meanwhile, unusually high melt rates for the time of year have been observed over Greenland this week.
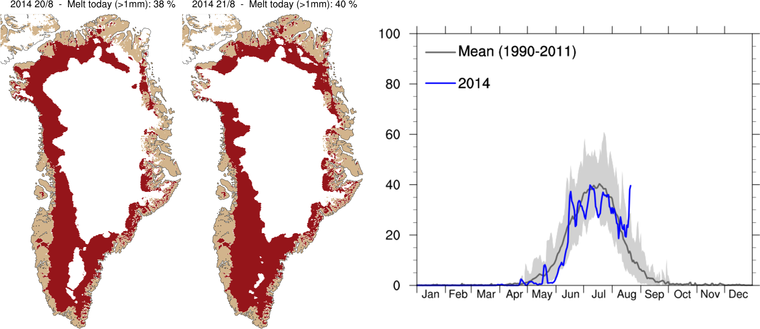
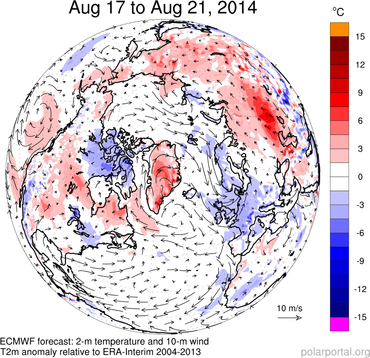
Scientists at DMI were surprised this week when they checked results for Greenland and saw very high melt rates and low surface mass balance as a result (Figure1). “It looks like the heat from Northern Europe has moved over to Greenland” said Kristian Pagh Nielsen, a physicist at DMI’s Centre for Meteorological Modelling. The summer had seen average temperatures in Greenland until this week when warmer air and clear skies from have allowed increased melting over the ice sheet (Figure 2).
When compared with the reference period of 1989 – 2011, such a large area of melt has never been observed at this time of year. It will likely mean that the surface mass balance for the 2013 – 2014 season will be one of the lowest in the record, though likely not as low as the record-breaking 2012 season.
 |
These early results for 2014 from DMI are in line with findings from a new study by the European Space Agency and the Alfred Wegener Institute for Polar Research that shows ice loss from Greenland has more than doubled since the first decade of the 21st century. The ice sheet in Greenland is now contributing on average about 1mm/year to global sea level rise.
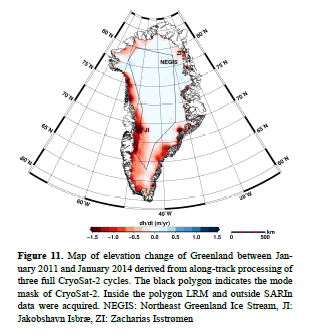
The study used radar data with unprecedented accuracy from the ESA Cryosat-2 satellite for both the Antarctic and Greenland ice sheets over the period January 2011 to January 2014. The scientists at the Alfred Wegener Institute calculated that over this period, both ice sheets together contributed around 500 km3 of water to the oceans every year with Greenland contributing about 75% of this. Figure 3 shows the change in surface height measured by satellite over the study period.
Much more detailed information on the present conditions over the Greenland ice sheet can be found at:
and
Citation: Helm, V., Humbert, A., and Miller, H.: Elevation and elevation change of Greenland and Antarctica derived from CryoSat-2, The Cryosphere, 8, 1539-1559, doi:10.5194/tc-8-1539-2014, 2014.
The paper discussed here can be downloaded in full at:
