
Welcome to the arctic monitoring web-site
The Danish Arctic research institutions present updated knowledge on the condition of two major components of the Arctic: The Greenland Ice Sheet and the sea ice
Unusually Early Greenland Melt
By Ruth Mottram, DMI
April 12th 2016
An early melt event over the Greenland ice sheet occurred this week, smashing by a month the previous records of more than 10% of the ice sheet melting.
 |
 |
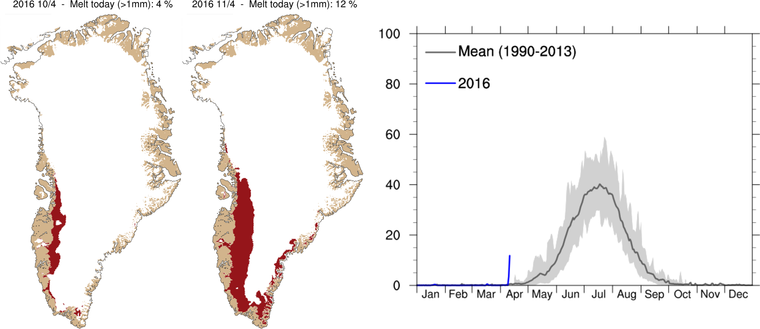
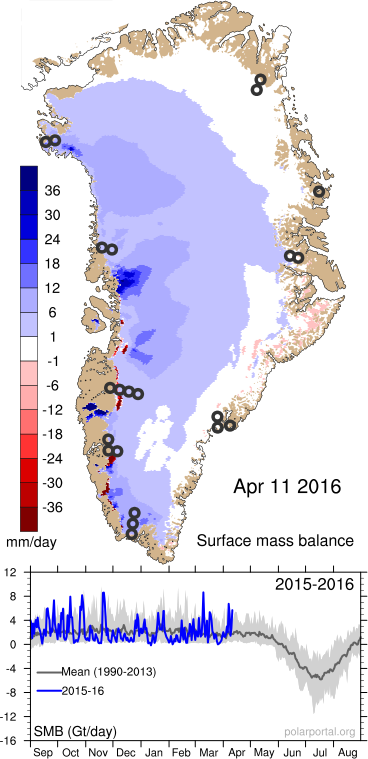
Based on observation-initialized weather model runs by DMI, almost 12% of the Greenland ice sheet had more than 1mm of melt on Monday 11th April, following an early start to melting the previous day. Scientists at DMI were at first incredulous due to the early date. “We had to check that our models were still working properly” said Peter Langen, a climate scientist at DMI. “Fortunately we could see from the PROMICE.dk stations on the ice sheet that it had been well above melting, even above 10 °C. This helped to explain the results”. The former top 3 earliest dates for a melt area larger than 10% were previously all in May (5th May 2010, 8th May 1990, 8th May 2006).
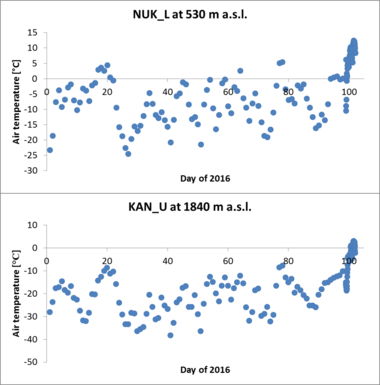
“Even weather stations quite high up on the ice sheet observed very high temperatures on Monday”, said Robert Fausto, a scientist at GEUS who maintains PROMICE.dk melt data. “At KAN_U for example, a site at 1840 m above sea level, we observed a maximum temperature of 3.1°C. This would be a warm day in July, never mind April”. Other PROMICE stations in the network at lower levels had daily average temperatures between 5 and 10 °C.
Similarly, around the coast of Greenland where DMI has climate records dating back to 1873, Greenland came close to setting a record temperature for the whole of Greenland in April. Kangerlussuaq measured a daily maximum of 17.8°C and the DMI observation station at the Summit of Greenland set a new “warm” April record of -6.6°C. “Averything is melting” observed Nuuk resident Aqqaluk Petersen.
The melt was driven by warm air advected from the SW bringing rain along the coast, similar to an extreme melt event in 2012 when 95% of the surface of the ice sheet had melt, a situation that has been reported in detail by GEUS and DMI scientists (Fausto et al., 2016).
 |
 |
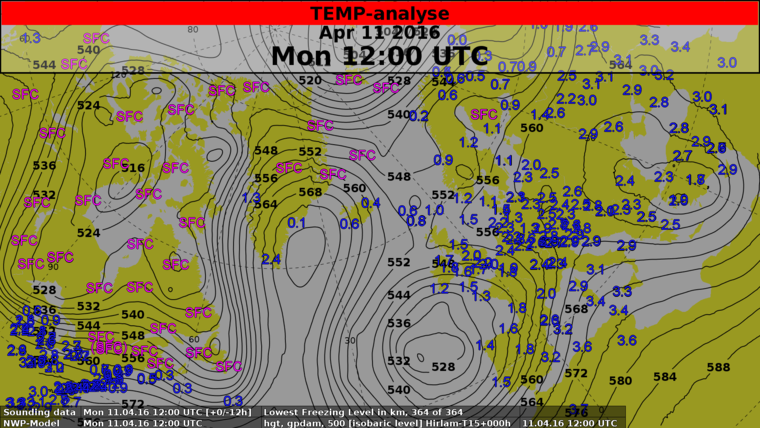
Martin Stendel, a climate scientist at DMI explains “it is a very unusual situation, especially so early in the year, with very cold air and deep low pressures system to the west and east of Greenland and very warm air forming a “cap” over the island. This helped to force a frontal system with very warm air up the west coast bringing rain over the ice sheet. A freezing level of 2.4 km over Narsarsuaq is highly unusual (compare to Portugal), as is a 500 hPa height of almost 5760 m, a value typically observed in the subtropics – in summer. The very cold weather by contrast in north eastern Greenland is exactly what we would expect with this pattern.”
Weather forecasters Marie Rasmussen and Jesper Eriksen at DMI expect the situation over Greenland to gradually cool over most of the island this week, though a new frontal system from Thursday may again cause widespread melt especially in the south.
Rainfall and meltwater on the ice sheet at this time of year mostly runs into the snow and refreezes. “Meltwater refreezing releases heat into the snow at depth, reducing the amount of heating needed for melt to start and forming ice layers that can help melt water run off the ice sheet earlier with climate warming” said Prof. Jason Box at GEUS who leads a Danish Research Council project with Fausto, DMI, and DTU colleagues (http://retain.geus.dk/).
As the daily surface mass balance plot shows, the blue shows a mass gain, most likely from freezing rainfall and perhaps some snow, as the small dark red areas show an overall loss of ice.
The unseasonal and rather extreme melt event made headlines with the international press. Her are some of the many stories:
- Washington Post: Scientists are stunned by what just happened in Greenland
- The Guardian:Greenland sees record-smashing early ice sheet melt
- Associated Press: Scientists: Greenland ice sheet is melting freakishly early
- CBS: "Very unusual" melting seen on Greenland ice sheet
- New Scientist: Record early ice melt in Greenland due to freak warm weather
- Scientific American: Greenland's Melt Season Begins Almost 2 Months Early
- Weather.com: Greenland's Melt Season Starts Nearly Two Months Early
- Mashable: Heat wave in Greenland triggers record early start to ice melt season
- Climate Central: Greenland’s Melt Season Started Nearly Two Months Early
- Slate: Greenland’s Ice Sheet Is Melting So Fast Right Now, Scientists Thought It Was an Error
- Gizmodo: Huge Portion of Greenland Started Melting This Week
