Loading...

|

|

|

We are experiencing technical difficulties with the permafrost model, so the permafrost figures have not been updated since 16 June. We are working on a solution.
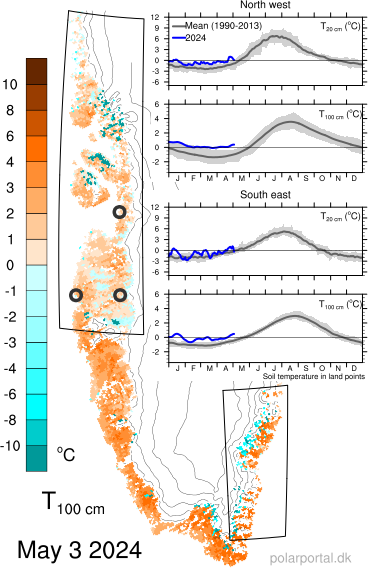
Temperature in 1 m depth, calculated with the GIPL permafrost model, which is driven at the surface by data from DMI’s run with the HARMONIE-AROME weather model for Greenland.
The curves show the average temperature in the boxes marked in the figure (Northwest and Southeast Greenland, respectively) at 20 cm and 1 m depth.
The map is updated on a daily basis.
The temperatures shown on the map are not observed, but rather a model product. By clicking on the circles one can see the observed permafrost thermal regime in the three towns of Sisimiut, Kangerlussuaq and Ilulissat in western Greenland. Temperatures are continuously monitored in borehole installations at the three sites, and the data downloaded upon station visits typically once per year.
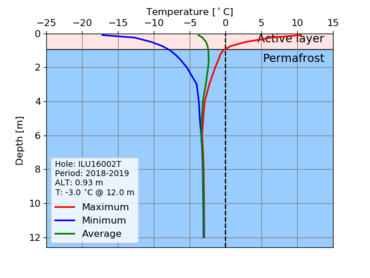
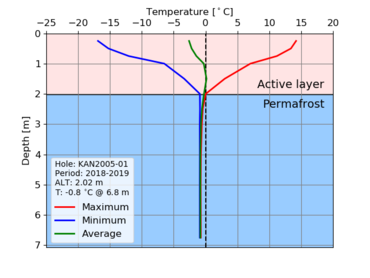
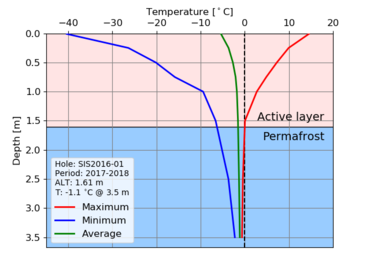
The figures show the minimum (blue) and maximum (red) observed temperature as well as the average (green) temperature over the course of one year (from August 1 to July 31).
The depth at which the maximum ground temperature (red curve) is 0°C designates the maximum thaw depth of that year, and thus the top of the permafrost. Above this level, there is a layer which is frozen in winter and thawed in summer, the so-called active layer.
The deeper permafrost temperatures are relatively warm at the southern sites (Sisimiut and Kangerlussuaq) and colder at the northern site (Ilulissat).
The temperatures close to the surface are much more variable at the inland station Kangerlussuaq with its continental climate than at Sisimiut, which is close to the coast.
Read more.
The figure to the left shows the ground temperature measured at different depths below the ground surface by the Greenland town Ilulissat, a so-called temperature profile. The figure is active, and by using the slider below, you can flip through temperature profiles measured on different dates. The black curve represent the temperature profile on the indicated date, while the lighter gray curves show the temperature profiles on the previous dates for comparison. By looking at the temporal variation in ground temperature, you can see how the upper part of the ground thaws in the summer and freezes in winter. This layer, which thaws and freezes with the seasons, is called the Active Layer.
The thermal variation in the ground is primarily driven by the variation in air temperature, but is also affected by precipitation (especially snow), the ground surface properties (e.g. vegetation, color, etc.) and the insolation, as well as the ground thermal properties and water/ice-content.
In the other figure, a so-called trumpet curve is shown. Here the red curves represents the maximum temperature measured at each depth in the course of one year. The blue curve similarly shows the coldest temperature measured at each sensor depth and the green curve the average temperature over one year. From the trumpet-curve, the active layer thickness (the maximum thaw depth) and the permafrost temperature can be found. The part of the ground considered permafrost has a light blue background color in the figure.
The figure to the left shows the ground temperature measured at different depths below the ground surface by the Greenland town Kangerlussuaq, a so-called temperature profile. The figure is active, and by using the slider below, you can flip through temperature profiles measured on different dates. The black curve represent the temperature profile on the indicated date, while the lighter gray curves show the temperature profiles on the previous dates for comparison. By looking at the temporal variation in ground temperature, you can see how the upper part of the ground thaws in the summer and freezes in winter. This layer, which thaws and freezes with the seasons, is called the Active Layer.
The thermal variation in the ground is primarily driven by the variation in air temperature, but is also affected by precipitation (especially snow), the ground surface properties (e.g. vegetation, color, etc.) and the insolation, as well as the ground thermal properties and water/ice-content.
In the other figure, a so-called trumpet curve is shown. Here the red curves represents the maximum temperature measured at each depth in the course of one year. The blue curve similarly shows the coldest temperature measured at each sensor depth and the green curve the average temperature over one year. From the trumpet-curve, the active layer thickness (the maximum thaw depth) and the permafrost temperature can be found. The part of the ground considered permafrost has a light blue background color in the figure.
The figure to the left shows the ground temperature measured at different depths below the ground surface by the Greenland town Sisimiut, a so-called temperature profile. The figure is active, and by using the slider below, you can flip through temperature profiles measured on different dates. The black curve represent the temperature profile on the indicated date, while the lighter gray curves show the temperature profiles on the previous dates for comparison. By looking at the temporal variation in ground temperature, you can see how the upper part of the ground thaws in the summer and freezes in winter. This layer, which thaws and freezes with the seasons, is called the Active Layer.
The thermal variation in the ground is primarily driven by the variation in air temperature, but is also affected by precipitation (especially snow), the ground surface properties (e.g. vegetation, color, etc.) and the insolation, as well as the ground thermal properties and water/ice-content.
In the other figure, a so-called trumpet curve is shown. Here the red curves represents the maximum temperature measured at each depth in the course of one year. The blue curve similarly shows the coldest temperature measured at each sensor depth and the green curve the average temperature over one year. From the trumpet-curve, the active layer thickness (the maximum thaw depth) and the permafrost temperature can be found. The part of the ground considered permafrost has a light blue background color in the figure.