


|

|

|
Welcome to the arctic monitoring web-site
The Danish Arctic research institutions present updated knowledge on the condition of two major components of the Arctic: The Greenland Ice Sheet and the sea ice
Glacier Front Positions
Approximately half of the total ice mass lost every year from the Greenland Ice Sheet is discharged into the sea as icebergs through marine-terminating outlet glaciers, while the other half runs off as melt water.
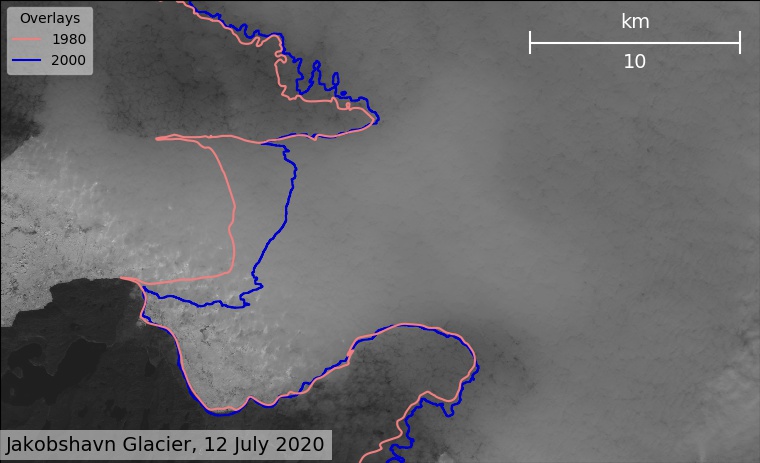
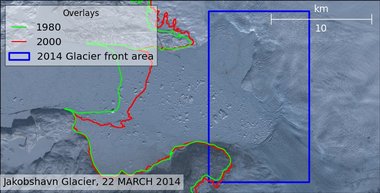
On this map, you can click on twenty major outlet glaciers and see the most recently available satellite image. The key information in the picture is the position of the glacier front. On each satellite image, the positions of the glacier at the end of the melting season in September (“terminus”) are shown for the year 2000 (marked with a red line) and for the mid-1980s (marked with a green line).
In this example of a satellite image, you can see how the glacier front has retreated from its position in the 1980s to that in the year 2000, and retreated even further until now. The glacier fronts are marked with blue the frame.
All satellite images displayed are from the Landsat 5, Landsat 7 and Landsat 8 satellites. The ground resolution of the original images is 30 m x 30 m, rescaled here to obtain a suitable image size over the areas of interest. Updates follow the availability of new images and are more frequent for major outlet glaciers; however, at times cloud cover will obstruct the view. The original Landsat data are available from the U.S. Geological Survey. The overlays of the positions of the glacier terminus are based on Citterio and Ahlstrøm (2013) and by Howat et al. (2014) processed at GEUS by Filippo Calí Quaglia.
Clicking on the green box shows measurements of ice velocity of Jakobshavn Glacier fra Sentinel-1 satellites.
Monitoring of glacier margin positions is a component of PROMICE, the Danish Programme for Monitoring of the Greenland Ice Sheet.
Reprocessing of older archived data is progressing, so the displayed historical series is gradually extending back in time.
More information:
