
Welcome to the arctic monitoring web-site
The Danish Arctic research institutions present updated knowledge on the condition of two major components of the Arctic: The Greenland Ice Sheet and the sea ice
Increasing melt from the ice sheet in Southwest Greenland
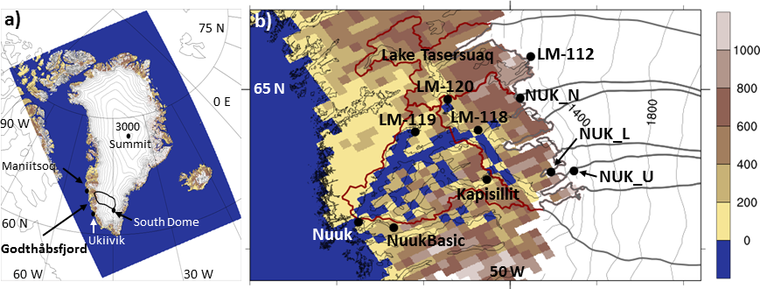
DMI researchers have developed a model that describes the details of melting from the Greenland Ice Sheet. The researchers will now be able to get a clearer picture of how climate changes will impact the ice sheet. In a new study, they look closely at the Godthåbsfjord area in the Southwest where melting has increased over the previous decades.
According to the new study, the surface mass balance has been decreasing in the Godthåbsfjord area between the 1990’ies and the 2000’s. The surface mass balance is a measure of the difference between what is gained through snowfall and what is lost through melting. To get the complete picture, the mass that is lost directly to sea (eg, when icebergs calve off) must also be included.
“A healthy ice sheet has a positive mass balance, that is, a net gain of snow that can counter the loss of ice that occurs at the coast. The surface mass balance has been declining and in the final part of our model run, it is even negative. Then we really lose ice, because there is nothing at the surface to outweigh the iceberg losses,“ says climate scientist Peter Langen from DMI. But he then cautions that “the large melting is heavily influenced by the weather in the individual years.”
The study relies on results from DMI’s regional climate model over Greenland and focuses on the part of the ice sheet in the Southwest that drains into the Godthåbsfjord. The work is a result of collaboration between institutes in Greenland, Iceland, Canada and Denmark under the Greenland Climate Research Centre.
The results are being published in the Journal of Climate and came out online last week.
Details on very small scales
“With this paper, we are reaping the benefits of a large development effort which allows us to study the processes that control the increasing melt that the satellites have observed over the last decade,” says Peter Langen.
Simply speaking, a climate model divides the world into small rectangles. The size of these rectangles is called the resolution and sets the limit for how small things you can study with the model. You can compare it to the pixel size in a digital image. In this study, the scientists used a resolution of 5 km, and while this is a common resolution in weather forecasting, it is extremely small for a climate model.
| The model The model is a so-called regional climate model. This means that it does not cover the entire globe but only a limited area. In this case, the model is set up to cover Greenland and the surrounding seas. On the boundary of the model domain, the model receives information every six hours about temperature, wind and humidity. This information comes from the European Centre for Medium-Range Weather Forecasts, ECMWF. The model was run in this way from 1991 to 2012. |
|---|
 |
“We are now beginning to resolve the detailed structures of fjord arms and outlet glaciers that play such a large role along large parts of the Greenland coastline,” says Peter Langen.
An important part of the study has been an enhancement of the part of the model that describes snow and ice.
“We now have a more realistic representation of melting processes, runoff and refreezing of meltwater inside the snow pack,” says glaciologist and climate scientist Ruth Mottram from DMI, who has specialized in modeling these effects.
A better handle on future melt
The fine resolution makes it easier to compare observations to what the model shows. You can go into the model and see if modeled values fit with what has been observed. This allows for an assessment of the uncertainty on the model results.
“We have lots of observations of the melt from stations on the ice sheet. But it is tricky to give total numbers for the entire area based only on these point measurements,” says Ruth Mottram and continues “with the new model we can make thorough comparisons with observations and have larger confidence in the results.”
The study has shown that the declining surface mass balance in the Godthåbsfjord area is due to increased melting, with a minor contribution from a decrease in snowfall. The greater melting is mainly caused by increased energy supply associated with more frequent southerly winds and a decrease in cloud cover.
The next step is to analyze the results over the entire ice sheet to study the regional differences in the governing processes.
“We will also run the model out into the future by driving it with future scenarios from our global climate model. We can then take advantage of the high level of detail in the new model to give more accurate estimates of the impact of climate changes on the ice sheet,” says Peter Langen.
Follow the daily changes in the modeled surface mass balance here on Polar Portal.
