
Velkommen til Polar Portal
Her formidler DMI, GEUS og DTU de seneste observationer og den nyeste viden om is- og klimaudviklingen i Arktis
Kun på engelsk: The Ablation Season Starts in Greenland
By Ruth Mottram, Climate Scientist, DMI
The summer ice loss season in Greenland started on the 6th June this year, since then the ice sheet has lost at least 1 Gigatonne of ice to the ocean every day. 1 Gigatonne of ice is one billion (one thousand million) tonnes and corresponds to 1 cubic kilometer of water.
The ablation season in Greenland is the name scientists give to the period when the ice sheet loses more mass from melting along the edges than it gains from snowfall on top. This is usually June, July and August. Scientists at the Polar Portal define the start of the ablation season as the first of three days in a row when the ice sheet loses more than 1 Gigatonne of ice from its surface to the ocean. This is impossible to measure by satellite, but DMI uses a computer model that uses observations to calculate how much snow and ice has melted in Greenland. On the first three days of the 2016 ablation season Greenland lost around 1.6, 2.2 and 2.4 Gigatonnes respectively.
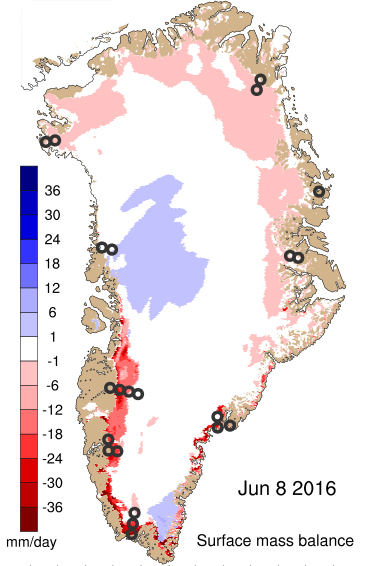
Left: Daily plot for the first day of the ablation season showing the surface mass balance of the Greenland ice sheet. Blue colours indicate mass gain by snowfall or condensation at the surface, red colours indicate mass loss by evaporation and by meltwater running off to the ocean. Black circles show the locations of the PROMICE.dk weather stations operated by GEUS on the ice sheet. Right: Two graphs showing surface mass balance since 1st September 2015. The upper graph shows the contribution from every point on the map in Greenland every day and the lower shows the accumulation of these contributions through the mass balance year. The mean curve from the period 1990-2013 is shown (dark grey) and the differences from year to year are illustrated by the light grey band, though omitting the lowest and highest values of the 24 years. The red line shows the corresponding curve for the record high melt 2011-2012 season. The surface mass balance only considers processes happening at the surface, it does not include the calving of icebergs which is an important additional source of ice loss in Greenland. When all sources of ice gain and ice loss are taken into consideration, the ice sheet is losing more ice than it gains each year in recent decades.
Climate Scientist Peter Langen stated “This is the sixth earliest onset of ice loss in our 27-year record, although there isn’t really a large difference from one year to the next in the top-ranking 17 years. The full range in annual start of mass loss is about a month. The earliest 24th May in 2010, and the latest was the 28th June in 1999. An earlier than average start to the ablation season sets the tone for an above average loss of ice in Greenland, although anything can still happen. We will have to wait and see how the season develops before we can draw any conclusions.”
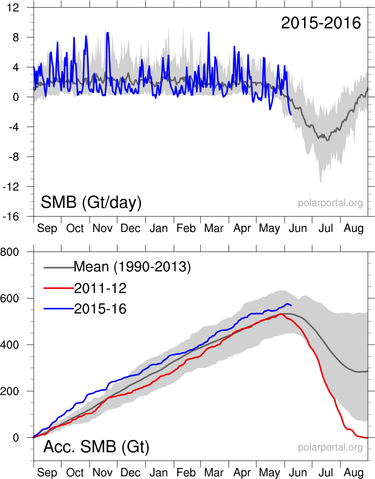
Data from the PROMICE.dk weather stations on the ice sheet, operated by GEUS, have again been showing high temperatures. These stations have already measured a lot of ice melt “At our weather stations we use special instruments to measure the amount of melt at the surface. We can use these also to check on the numbers we get out of the computer models. In south and southwest Greenland we have already seen up to 1.5 m of ice loss. This is about 20% of all melt we get in an average year. Last year melting at these sites didn’t even start until now, the second week of June” said Dirk van As, PROMICE.dk project manager. “This is in part because of the very early start to melting in April, as well as a very warm period we observed in early May” (see below).
Graph showing air temperature (top) and ice height (bottom) observed at the PROMICE.dk weather station at NUK_L, on the ice sheet in south west Greenland.
Warm temperatures are forecast to continue across Greenland today (the 9th June) and the next few days and have also affected operations at the East GRIP ice core site in north eastern Greenland where the Danish Minister for Research and Education was visiting. In the south west of Greenland temperatures up to 10°C have been measured over the ice sheet.
A note on units:
On the Polar Portal we count everything in water equivalent units to save having to distinguish between snow and ice which have different densities. 1 gigatonne of ice will still weigh 1 gigatonne when it is melted but the volume will be lower since ice expands when it freezes. 1 metric tonne of water is 1 cubic metre in volume and 1 billion metric tonnes of water is 1 km3 (a cubic kilometre of water). A cubic kilometre of ice does not therefore weigh 1 gigatonne but about 10% less because of the density difference. 100 gigatonnes of water is roughly 0.28mm of sea level rise (on average, note there are big regional differences in how changes in sea level smooth out) and 1 mm sea level rise is 360 Gt of ice, so 1 Gigatonne of water, our threshold for the ablation season equates to about 0.0028mm of sea level rise. On average over the last decade the Greenland ice sheet has been losing mass (including by calving icebergs) between about 200 and 300 Gigatonnes a year, which is a bit less than 1mm of sea level rise every year.
If it helps to visualize this amount of water, in this Washington Post piece by Chris Mooney, 1 Gigatonne is defined as “well over 100 million African elephants”.
